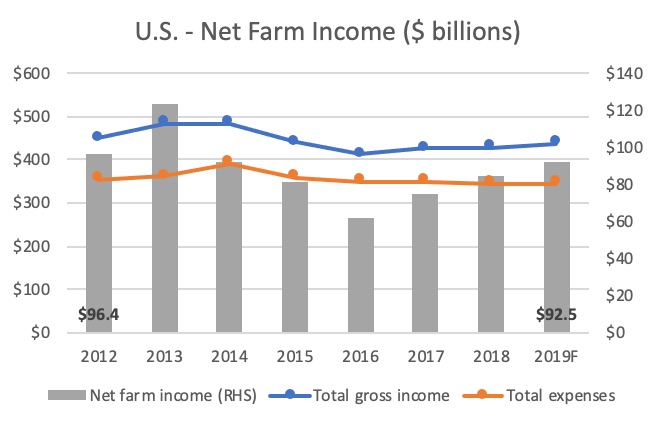
U.S. Net Farm Income has navigated a “rocky road” over the past seven years. Despite declines in Net Operating Income, farmland asset prices have continued to rise. The November 2019 – USDA Farm Sector Indicator report provides deep insight to farmland profitability and operational shifts that have occurred. As displayed below, Net Farm Income has modestly declined from $96.4 to $92.5 billion (-4%) over the past seven years. After a precipitous decline from 2013 to 2016, from $124 billion to $82 billion, Net Farm Income, or profitability of U.S. farms have rebounded to $93 billion nationally in 2019.
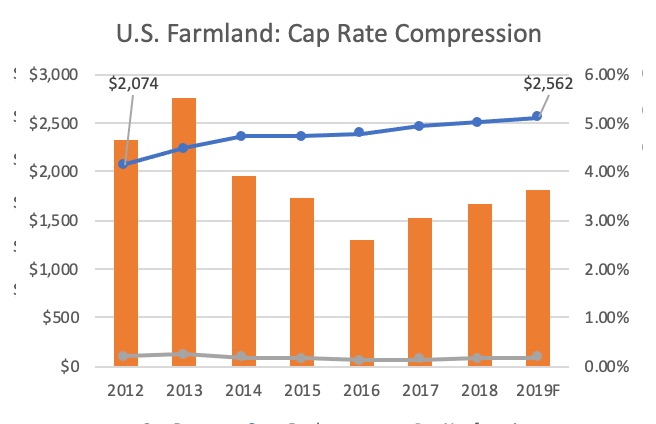
When observing real estate values on the USDA National Farmland balance sheet, one would quickly observe why farmland as an investable asset class continues to attract investment. Asset prices have been stable, and consistently increasing over this period. When analyzing Net Farm Income as a percentage of the real estate equity value, one may quickly observe the history of farmland valuation. The decline is due to both decreased farm profitability and stable to increasing farmland valuations. Simply put, the following quantitatively proves the anecdotal narrative of cap rate compression in farmland markets nationally.
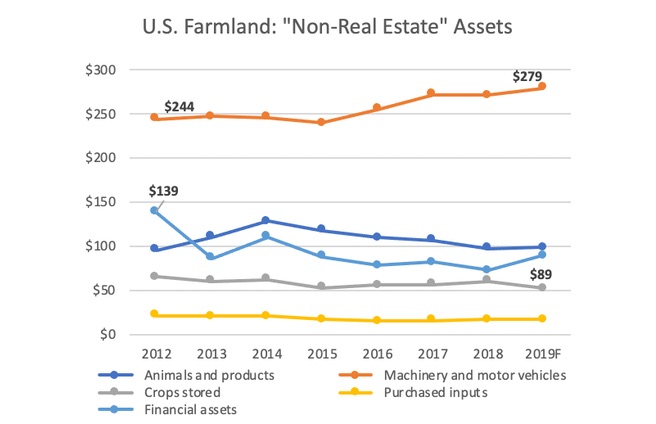
U.S. Farmland real estate equity increased from $2.073 trillion to $2.562 trillion in seven years, a 23.5% increase or 3.59% compounded annual growth rate (CAGR). However, when observing farm operator balance sheets, total “non-real estate” assets have decreased $29.7 billion from 2012 to 2019. The greatest off-loading of non-real estate assets has been a reduction of input purchasing, which decreased $5.3 billion and a decrease of financial asset purchases, which shrank $50.0 billion over the seven-year period. Certainly one reason for these redcutions may be the liquidization of “non-essential” assets needed to meet low commodity price pressure. The following chart demonstrates how the equity components of U.S. farm operations have decreased “ex-real estate” assets. As displayed, there has been modest growth in Machinery and motor vehicles ($35.3 billion increase), reflecting increased capital expenditure investments for operations.
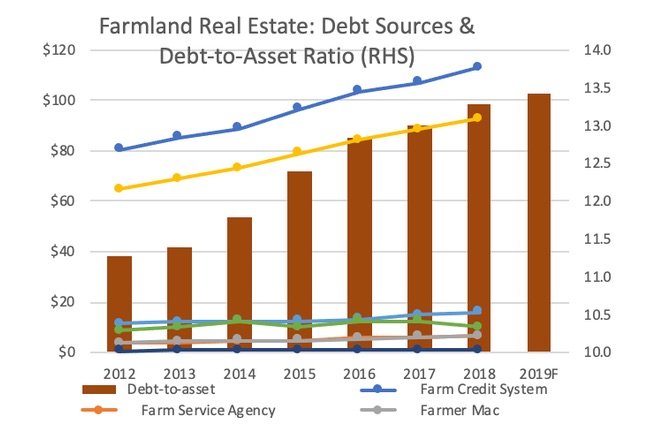
In regards to debt, farmers have dramatically increased in debt levels, exceeding the increases in total assets. The chart below reveals the unique debt sources and the total debt accumulated by U.S. farmers. There has been a continued extension of traditional financing sources, the Farm Credit System and commercial banks, to meet the increased demand for debt. The right axis (bar graph) reveals the increase in the debt-to-asset ratio, exposing increased leverage to maintain profitability.
This all to say, the national analysis of farmland balance sheets demonstrates a shift in capital markets to fight decreased operational profitability by increasing debt levels and off-loading non-essential assets. These operating decisions have been made to buoy Net Farm Income, as real estate-specific asset prices continuing to grow.
Investor Perspective & Long-Term Commentary
From an investment perspective, these fundamentals still provide attractive features for farmland as an asset class. We recognize the unique geographical regions particularly exposed to tightening Net Farm Income and potential bubbles of unmerited real estate appreciation. We will track these regions and crop types with acute awareness. However, on the macro, as elaborated upon by many other farmland investor thought pieces, the uncorrelated nature of farmland returns, the stable income production from cash rent agreements, and underlying asset price appreciation, result in farmland investment as an attractive institutional portfolio diversifier. It will be of keen interest to observe farmers focus on increasing net operating income. There are only two fundamental levers to affect revenue growth: increase yields or prices. Yields are being targeted through advancements in technology, precision agriculture, autonomous equipment, proactive soil health management and water optimization strategies. These developments reflect producer innovation and highlight a penchant to drive the supply side of the equation. The greatest headwinds are concentrated in commodity markets. There is a great need for near-term price growth. From the operator perspective, diversified, higher-valued commodities, such as fruit, citrus, nuts, and organic products, have experienced increased demand by shifts in consumer preferences. Traditional crops, such as corn, wheat, potatoes and hay, hope for “relief” in the coming years, and a return to more profitable pricing.
In conclusion, there are many investors who recognize the tailwinds of farmland real estate price growth over the long-term horizon (15-30 years). Many attribute this endogenous growth primarily to population growth (7.3 billion to 9.5 billion people, from 2015 – 2050) and increased caloric consumption from developing countries (India, Africa and Southeast Asia). This dramatic increase in forecasted caloric consumption is expected to occur on a constrained global environmental resource set (water, quality soils, etc.) and diminishing farmable acres. This creates a simple, yet dramatic supply-demand imbalance. We assess the short-term weakness in commodity prices will stabilize, leading to increased farm profitability. The offloading of “non-real estate” assets and increased profitability will lead to strategic technology capital deployment yielding long-term efficiency gains. The pricing rebalances complemented with the continued adoption of technology will further stimulate annual yields and long-term asset quality. Overall, the “new environment” will continue to drive long-term farmland real estate specific asset prices.
By Brent Lawson